Open most mobile app dashboards and you’ll see the same mobile app ROI metrics at the top. Total Downloads and Registered Users.
They look impressive. They’re easy to celebrate.
And they’re almost useless when it comes to predicting ROI. They tell you almost nothing about whether your app will still be alive a year from now.
You can cross a million downloads and still bleed cash if users disappear after the first session, which sadly happens more often than any founder would wish for.
By 2026, this gap between impressive-looking dashboards and real business outcomes has only widened. User acquisition costs keep climbing, privacy changes have reduced targeting precision, app categories are saturated, and user patience is brutally short. You no longer get weeks, even days, to prove value.
In this environment, surface metrics collapse quickly. What matters is how fast users experience value, whether they return once novelty fades, and whether their behaviour can ever justify what it cost to bring them in. Across consumer and SaaS apps we’ve evaluated, metrics tied to retention and monetisation consistently outperform acquisition volume as predictors of long-term ROI.
Research from Gartner shows that only about half of senior marketing leaders can even prove the value their teams deliver, because they’re stuck on surface app KPIs for founders, not deep ROI‑linked measures like customer lifetime value and acquisition cost ratios.
Experienced teams know this. Which is why they stop obsessing over acquisition volume and start tracking app business metrics that predict long-term profitability. They chase real metrics, the ones that help concretely predict retention, monetisation, and sustainability of your business. It’s time to demystify mobile app KPI’s and focus on the ones you need to be paying attention to.
If you want to understand how to measure app profitability and whether your app will actually make money six months from now, we are going to talk about the five metrics that predict app success.
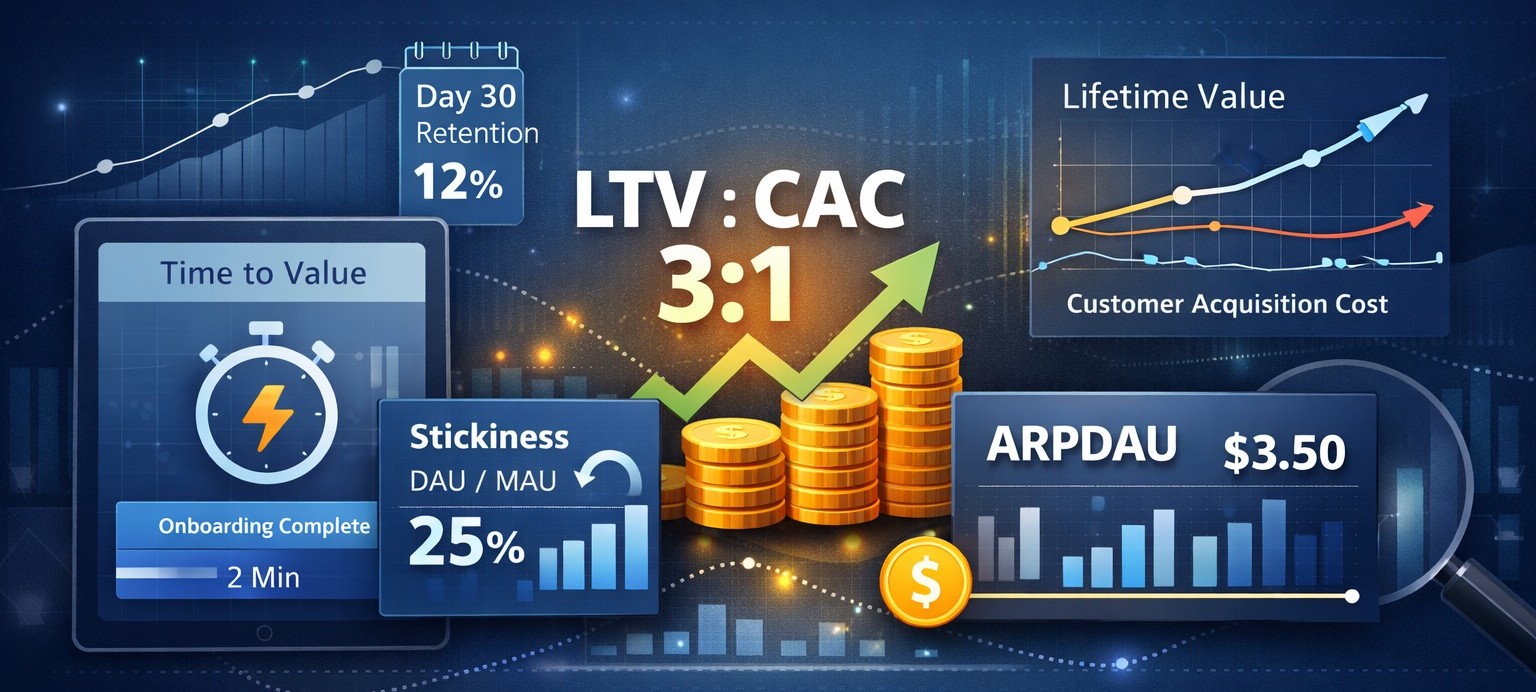
1. Stickiness (DAU / MAU Ratio)
Stickiness is where your product proves it belongs in people’s lives. In plain terms, it tells you how often people come back, without being chased. If users come back naturally, day after day, you know you’ve built something they actually want, not just something that looks good on a deck.
Stickiness is usually expressed as the ratio of Daily Active Users (DAU) to Monthly Active Users (MAU).
A DAU/MAU ratio around 20% or higher is widely considered the benchmark for habit-forming apps.
Why DAU:MAU matters for app ROI?
Because high stickiness reduces dependence on paid re-engagement. When users return organically, your Customer Lifetime Value (LTV) grows without increasing acquisition spend. That’s where margins quietly improve.
This is one of the clearest app engagement metrics for long-term health.
2. LTV to CAC Ratio (The 3:1 Reality Check)
The Lifetime Value to Customer Acquisition Cost (LTV:CAC) ratio is the most honest metric in app economics. It shows whether your growth is real or just dependent on marketing spend. Hit it right, and you can push forward without second-guessing every campaign. While user lifetime value consistently remains a priority for founders, the ratio is a nuance that can reveal much more.
Short‑term lead counts aren’t enough. Businesses are shifting to lifetime value and customer retention metrics to measure actual impact on revenue.
It answers one simple question: Are you actually earning more from your users than it costs to acquire them in the first place?
A 3:1 ratio is the sweet spot most teams aim for. Hit it, and you’ve got a model that can grow without more acquisition spend. Fall short, and every new user feels expensive and risky. Go much higher, and you might be playing it too safe. leaving growth and opportunity on the table.
This ratio isn’t just numbers. It’s a great way to measure app profitability over a period of time. It tells you when to double down, when to tighten focus, and when you can confidently push forward knowing the app is pulling its own weight.
3. Day 30 Retention Rate
Most apps lose users fast — often within days. Day 30 retention measures how many users still find the app valuable after the novelty wears off.
For many consumer apps, 10–12% Day 30 retention is a strong signal. Categories like fintech or health typically expect higher numbers.
Why it matters:
Day 30 is where the app proves it can survive real life. If users are still coming back, it means your product is becoming part of their routine, not just a novelty they try once. Retention is the foundation of everything else: monetisation, growth, even word-of-mouth. Nail this, and you can start building real momentum.
4. Time to Value (TTV)
Time to Value (TTV) measures how long it takes a new user to experience the app’s core benefit — the “aha” moment.
That could be:
- completing the first transaction
- booking the first service
- finishing the first meaningful action
In 2026, acceptable TTV is approaching zero.
Every extra second a user struggles is a lost opportunity. Shrink that gap, and the app starts proving itself immediately. Faster TTV means higher Day 1 and Day 7 retention, and more users who stick long enough to show real lifetime value.
This is one of the most overlooked metrics, but it’s also one of the easiest levers to pull. Nail it, and everything else in the chain has room to breathe.
5. ARPDAU (Average Revenue Per Daily Active User)
While ARPU (Average Revenue Per User) is usually tracked monthly, ARPDAU shows how effectively your app monetises each active day. It gives you an almost real-time pulse on whether your product improvements are landing.
Every tweak, every pricing change, every UX improvement shows up here first. When ARPDAU moves, you know whether the app is creating genuine value, not just looking busy.
This metric turns usage into insight. It’s where product decisions meet the market in real time. High ARPDAU doesn’t just feel good. It proves your work is making an impact.
The Bottom Line
If installs are still the primary success metric, it’s worth pausing and asking what they really represent. Downloads are easy to celebrate, but on their own they say very little about long-term outcomes.
The apps that sustain growth over time tend to focus early on how users actually engage: how quickly they experience value, whether they return, how consistently they use the product, and how that behaviour translates into revenue. Metrics like retention, stickiness, ARPDAU, and the LTV:CAC balance help bring that picture into focus.
Taken together, these numbers highlight where growth is durable and where it relies too heavily on continued spend. They help teams see what’s working, what needs attention, and where small improvements can compound. Teams that track these metrics early don’t scramble later.
Teams that don’t usually discover the problem when growth becomes expensive, not when it’s easy to fix.
In the long run, predictable ROI comes less from scale alone and more from building these fundamentals early and building them well. Watch out for our upcoming deep dives into each of these metrics and how to actually optimize them, so you not only track but actively grow your ROI. Stay tuned!