Everything you Need to Know About App Performance Metrics
Long before computers, internet and smartphones turned the world of information on its head, humans were still trying to measure everything, from the size of the earth to its distance from the sun. The obsession app makers have about tracking and measuring mobile app KPIs should therefore come as no surprise. What gets measured gets managed. Those are the words mobile app analysts live by as they go about sifting through pages after pages of data until they find just the insights they need to make sure their app is doing what it’s supposed to.
But not everything that counts can be counted, and not everything that gets counted, actually counts. That quote was reportedly found on Albert Einstein’s wall, and holds the key to monitoring your mobile app performance metrics. What KPIs you track and measure are crucial in guiding your marketing strategy in the right direction. There is a ton of information that can be monitored, but not all of it is equally useful. You need to focus on the right details that matter, and not get lost in a sea of insignificant data. To help you with just that, we’ve compiled this near exhaustive list of all the mobile app KPIs that every app maker must be measuring. This guide will also show you how to optimize each of these KPIs and ensure a rewarding ROI from your app.
How engaged are your users? How often they use your app and how much time do they spend in it? How many people sign up and how many leave? Those are the questions that determine the level of engagement your app is able to drive.

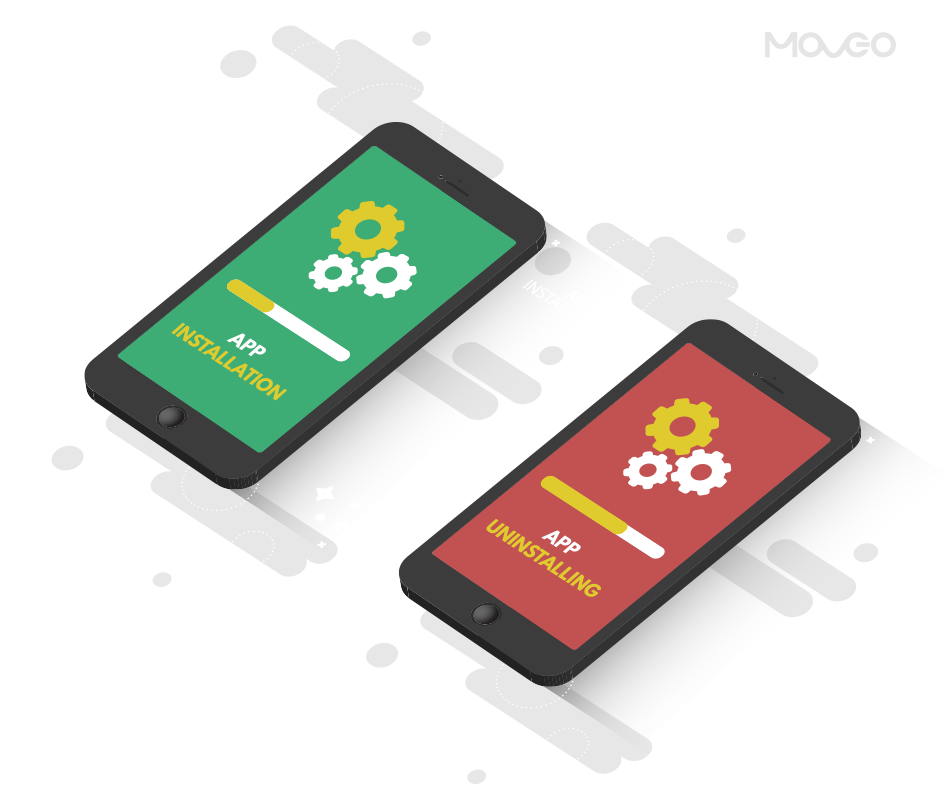
We’re going to start with this because this is one metric too hard to ignore. Even though the skeptics will (rightly) say that app download numbers don’t really matter if users uninstall your app soon after, we have to agree that more downloads usually mean more installs. So ‘app downloads’ remains a crucial metric, but remember to take it with a pinch of salt, and always view it in context to other metrics, that we will get to in a moment.
And yes, even if users uninstall your app soon after downloading, the app store will still count it as a download and the number will help your app store rankings and people’s perception of your app. Also, a higher number of downloads indicates that at least your app icon, description and other app store optimization efforts are paying off, so you can focus on the other aspects that need more attention.
If your download numbers are low to begin with, it is an indicator that your app is unable to grab eyeballs in the app store itself. You need to jazz up your icon, your app store description, screenshots and other features that will help casual app store browsers notice you. At this stage, you can worry about performance and engagement later, and focus on creating a strong anticipation first.
Tracking your app’s install rate might sound redundant at first, as you may think it is the same as downloads. But if there is a discrepancy between install rate and download rate, it means that some users are unable to download your app. This could be due to device or platform issues, or a different reason, but if every user matters, this is one area you will need to pay attention to.
Uninstalls on the other hand is a make-or-break metric. This is inarguably the one metric every app marketer wants to keep down. A high uninstall rate indicates that users gave you a chance but weren’t impressed enough to keep your app on their phones. There will always be some users who only intended to use the app once, or check it out casually. But a high install rate is a matter of grave concern, and if that happens, you need to go into an investigative mode and find out what caused the users to uninstall your app. This will require monitoring a whole other set of mobile app metrics that we will cover in the later parts of this guide.

So here comes the big player – app retention. Retention is one of the most important mobile app metrics as it tells you how many actual users you are left with, after factoring in all the uninstalls. Retention measures how many users came back to use your app after their first visit. Naturally, you want to keep this number as high as possible, and a large portion of your marketing efforts must focus on this particular metric.
Unfortunately, app retention metrics are rather dismal for most apps. According to latest data from Localytics, the average retention rate across all industries is a meager 20% after 90 days. The report also states that 24% users only use an app once. That’s far from enough for all the hard work you put into developing your app. So to keep your retention rate high, make sure you pack your app with some serious value that the user cannot do without. Provide an experience that is at par with the rising user expectations and keep a fine balance between communicating with your user and not overdoing it.
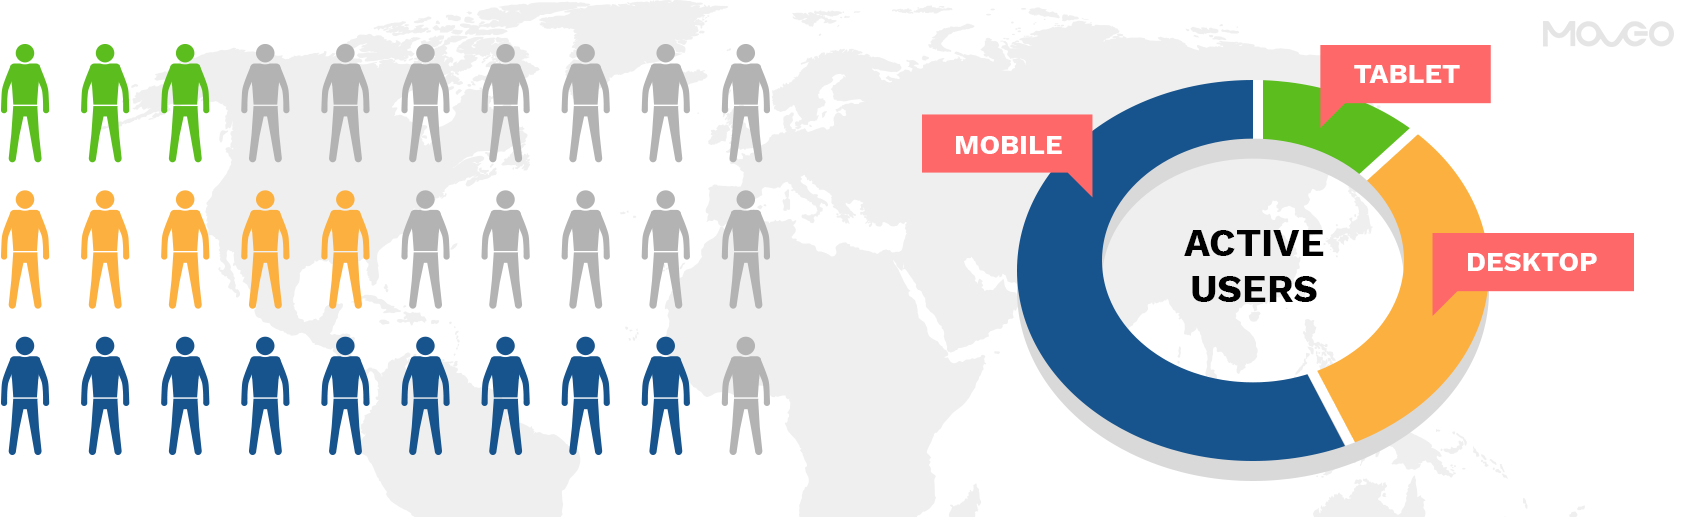
The active users metric is a clear indicator of how much engagement your app is actually driving. You need to know if your users are actively using your app, and how often are they doing so. Monitoring your daily active users (DAU) and your monthly active users (MAU) tells you a lot about engagement. As the name suggests, the DAU measure tells you how many users are using your app at least once every single day and the MAU measure shows you how many users are using your app at least once every month. This way, you can up the ante on your marketing efforts directed specially at the MAUs, in an attempt to turn them into DAUs. You can do this by carefully planned push messaging, special offers and incentives for using the app more often.
You want to know how often do users use your app and how long do they wait before using it again. That is what’s known as app session intervals and is another important engagement metric. You want to keep the app session intervals as short as possible, so that more users use your app more often every day. How you do that will depend on the type of app. Some apps are only meant to be used once a day, some several times a day and some are just about a few times a week. Depending on your app, set realistic targets and then try to achieve the app session interval you want to see. The only way to do this is to make your app so good, that users want to use it over and over again. Focus on incorporating features that have daily value or are worthy of becoming a part of your user’s routine. Once you have enough value to offer, use push notifications to bring your users back and stay in their subconscious. Provide repetitive value and whatever you do, don’t bore them or overdo the notifications.
How much time did the user spend in your app? That’s your visit time and average visit time can tell you a lot about your app and user behavior. First, know how much time it should usually take a user to accomplish the tasks your app is designed for. Then calibrate that against your average visit time to see if your users are leaving too soon or staying too long.
If your users are leaving too soon, it could mean that the app didn’t catch or keep their attention, they didn’t find what they came looking for, or they simply didn’t like what they saw. If this happens often, it is a cause of worry and you need to fix things.
If they stayed too long, you probably want to think it’s a good thing. They’re probably enjoying using your app, you’d think. But if the average visit time is unusually long, it could be a cause of worry. It’s possible that the users are having trouble finding what they want. They might be confused with the navigation, unable to trace a clear path of action and too distracted to complete a transaction. All of these could be detrimental to your business so keep an eye out for unusually long average visit times.
Here’s a more specific mobile app metric in the same vein as the previous one. If you want a stronger handle on how your users are spending their time in-app, monitor the average screen views per visit. This will tell you how many screens they are viewing in every session. The more time they spend and the more screens they visit, the higher engaged they are and that’s a great thing for you. These metrics also let you classify your users as less engaged and more engaged users, allowing you to tailor your marketing communication for each

Most apps have different events or activities that users can indulge in. for instance, they can either stream music, download music or share with friends. App event tracking allows you to monitor which features your users are using most, how they are interacting with the various features and how much time they are appending at specific events. Knowing this gives you an idea of what your users like and what they don’t much care about, allowing you to tweak or change features and add or remove events.
For instance, if your users like to share with friends a lot, you might want to make social sharing even easier and more interesting by adding one-click share buttons, creating in-app chat with friends or creating social media pages on which users can invite friends to use your app. This might actually result in powercharging your new user acquisition efforts too.
Another critical metric in the same vein as app retention, is app churn. Churn rate measures the number of people who stop using your app. Every user you lose is an opportunity lost and businesses do everything they can to keep every user from jumping ship. But the problem becomes worse when some of the best users such as highly engaged or highest revenue generating users stop using the app.
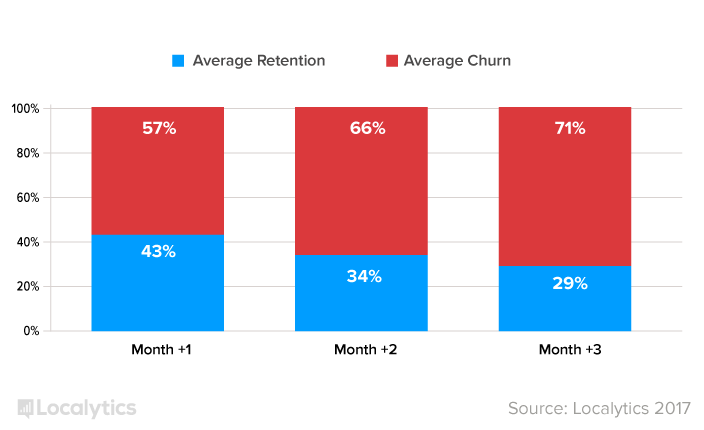
According to a 2017 Localytics report, most apps see an average of 58% churn rate in the first month, and by the end of three months, as much as 75% users churn. If your app is seeing such high churn rates, you need to take some serious steps to bring the numbers down.
To lower churn rates, you need to understand what’s causing your users to abandon your app. This would require you to study a number of other trends and metrics such as average session times, drop off points, touch heatmaps and also analyze performance metrics such as app crashes and bugs. This will help you find out any recurring patterns that are pushing users away or failing to attract them. You then need to fix those areas in your app, so that users continue to use your app over and over again.
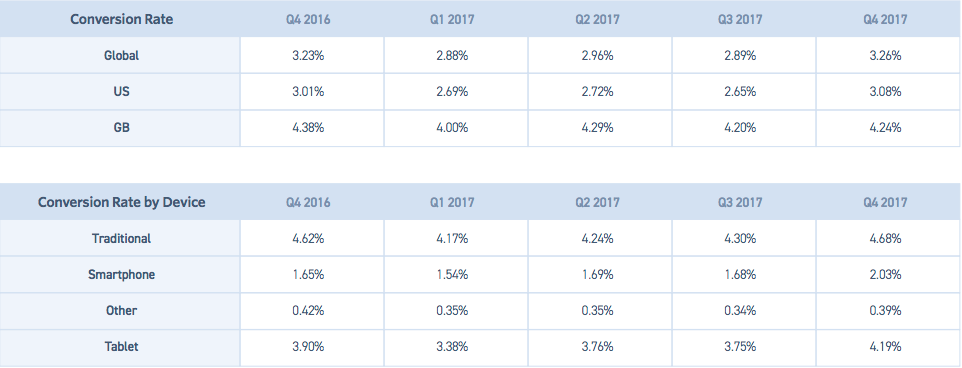
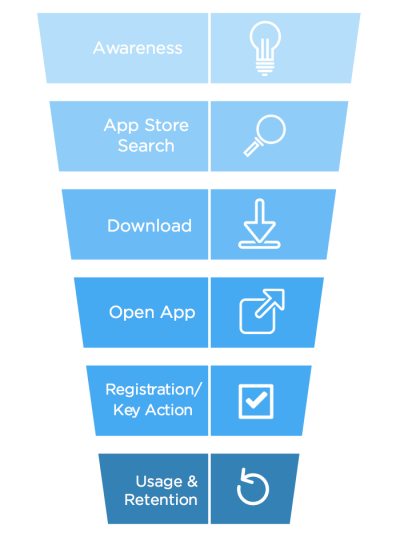
And here’s the mother lode. The conversion rate of your app is the number of users who are taking the action you wanted them to. This could be signing up and sharing their email information, or it could mean spending actual money and buying something from your app. Depending on your app’s final business goal, conversion rate tells you how successful your efforts finally are. In short, this metric identifies how much revenue you make. Once you have your conversion rate numbers, match them up with the industry average in your genres and see how well you are doing. If the numbers are low, you will need to find out where your users are dropping out of the conversion funnel (more on that later), and fix the leaks, so that all users who open your app end up completing the transaction. What’s a good conversion rate?
Every app flow has a funnel. How well you optimize your funnel is another topic for another day, but there always is, an entry point and a final exit that ideally ends in a conversion. If users don’t get to the conversion phase, they are dropping their session midway and leaving without completing a cycle. You need to find out exactly at what point are they abandoning the session and that will help you detect problems and fix leaks.
Source: Optimizely
For instance, if you are an ecommerce app, users enter the app to browse your collection, select a product, add to cart, fill in address and payment details and finally, make a payment and buy.
Now if users never got around to adding to cart, then it means your collection isn’t interesting enough, if they added to cart, but didn’t go through to entering personal information, it could be because the forms were too confusing and the checkout was complicated. If they entered their address but didn’t end up buying, it’s possible that you aren’t delivering to their address yet. If that happens a lot, you may want to consider expanding your delivery network.
So as you see, there can be so many leaks in an ideal app flow. Monitor your funnel drop offs to detect and fix the leak, so you can maximize your conversion rate.
This section focuses on mobile app KPIs that directly measure customer satisfaction in terms of the engagement they provide, the ratings they give your app and the reviews and feedback they leave.
How easily people can find you is directly responsible for how many users you amass and how much engagement you drive. That is why your app store ranking can very well be one of the most basic metrics you need to monitor, and fiercely work to improve. The majority of app downloads happen as a result of casual browsing through the app stores, so most of your other outreach efforts come second. What truly matters is your app store ranking.
So closely watch when your ranking improves or drops. Then analyze your app store optimization strategy and see where it could be improved. A/B test all your assets like icon, description, screenshots and featured reviews. Interact with users in the review section, resolve problems and create an engaged community that can build ratings, thus boosting your app store rankings.

Talking of app store ranking, one of the major influencers of it is your app’s rating. The better your rating, the higher you rank in search results and even land a spot in the featured apps list. Also, rating is one of the first things a user checks to adjudge if the app is worth their time. A rating any less than 4 stars is less likely to be downloaded by too many users, as they have a huge number of options to choose from and are entitled to the best.
So dynamically monitor your app store ratings and make sure they don’t dip. Take proactive measures to keep them high. You can send out prompts asking users to give you an all star rating while they are using your app. Be sure to time this well though. Also, get in touch with those who gave you a bad rating and solve their issues so they may consider changing their mind. Be active on the review forums and make sure you are tuned into what people are saying about your app so you can fix things that are making them rate you badly.
App reviews are the most direct form of user feedback, and definitely one of the most crucial ones. App reviews tell you exactly what the users feel about your app, what they like and what they absolutely abhor. So monitoring app reviews is a major source of knowledge about how to improve your user experience. Now it is true that monitoring app reviews isn’t exactly a sizeable and calculable metric, and needs more of a subjective human effort, but there are software solutions now, that can classify positive and negative reviews, and identify common trends and issues. So monitoring app reviews can be used as more of an objective metric today.
The important thing is to encourage more and more users to leave positive reviews. Staying active with your in-app communication and prompting users to leave a review are a few tricks that work.
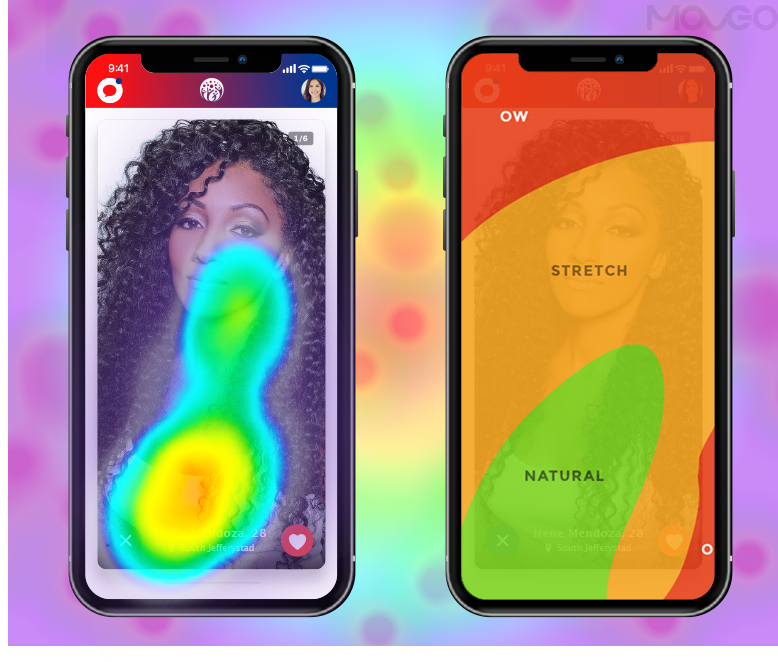
Touch heatmaps and session recordings are another way to find out how users are interacting with your app. Which parts of the app, even which sections of a given page, were most used can be easily seen via heatmaps. This can help you identify the popular features and highlight them in your future marketing communications. If you have some features that aren’t receiving as much attention as you think they should, you could launch campaigns to draw more attention to those too.
User recordings can help you discover if there are any areas where users are spending more time than it should take them. This could indicate a problem in the UX design that is making it difficult for users to navigate. Monitoring such trends can help you fix detractors or hang-ups in the navigation.

When a user needs support and cannot get it in time, it can be one of the biggest turn-offs. That’s why monitoring your app’s support response time is as crucial as monitoring a patient’s health. You can use various tools likeHelpScout and Zendesk to get a detailed picture of how many customer support calls are being resolved and how well they are being resolved.
Word of mouth recommendations from friends and family is still one of the biggest factors users consider when downloading an app. That is why one of your best bets on user acquisition is to create a strong community of users who love your app so much that they’d recommend it to their friends. So your app’s net promoter score is the likelihood of a user to recommend your app to another person. Each user is rated on a scale of 1 to 10 where users with the score of 9-10 are promoters, 7-8 are passives and everyone else is a detractor. Once you have the scores, the mission is to reduce the number of detractors fiercely to a minimum and try to push all the passives into the promoter zone. The only real way to do this is to provide an outstanding experience, but you could also work on prompting users to refer their friends, run a referral program and other strategies.
These metrics measure the technical aspects of your app such as speed and stability. Only when your app is technically sound, works at optimal speeds doesn’t, crash and freeze and does what it’s supposed to do can you expect it to be useful to the user and hence worthwhile to you.
Did you notice how every new phone a company launches, promises a faster processor, more RAM, more memory and all other features that give you speed? It’s an established fact – mobile users thrive on speed. They have no time for apps that are slow to load and keep users waiting. They need apps that are up and running instantly, respond to every touch and are ready in a second’s time. Transitioning from one page to another too must be swift and smooth. Any latency cuts your chances of keeping that user by a large fraction. So keep an eye on the app loading time and make sure to keep in under a second, or two at max.
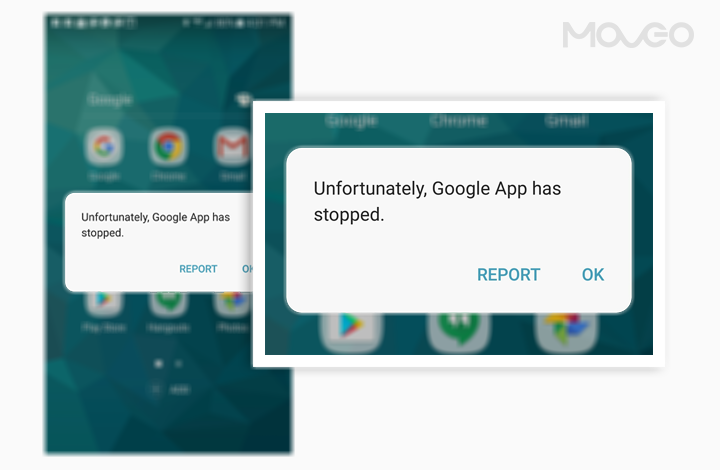
A crash refers to an app suddenly shutting down or abruptly closing while the user is using it. While we still entertain a point or two about app crashes in lists like these, the ground reality is that users no longer tolerate app crashes, so really, you shouldn’t be having crash incidents. If you do, fix them.
The experts at TechCrunch profess that if your app crashes once, you are just about likely to receive just about one more chance before the user completely abandons and uninstalls your app. So monitor how many times your app crashes, find out how many times a day does this happen and how many users were affected. Once you have an idea of the damage, do everything it takes to make sure it doesn’t happen again.
Close on the heels of app crashes, unresponsive gestures are another mobile app KPI that users have no tolerance for. If they tap, swipe or pinch and nothing happens, you could very well lose a few users who are just about forming an impression about you.
You need to set up monitoring for every unresponsive gesture and find out where and why they are happening, and fix them before too many users are affected.
Another significant app performance KPI is app latency. It measures the time an app takes to receive a response from an API. Just like the load time, this one too must be kept to a minimum, giving users an almost zero delay experience.
Network errors are a part of the problem that causes app crashes. Essentially, when an app is trying to connect to a network but it fails, you will see an HTTP error. While some network errors are unavoidable, you need to manage and minimize them as effectively as possible. Use intelligent caching of information and test repeatedly to make sure you keep the incidence of network errors as low as possible.
At the end of the day, an app must generate revenue. Monitoring the inflow of revenue lets you effectively channel your marketing efforts, know which campaigns are working and find out how to increase revenues.
One of the most basic mobile app KPIs is its total revenue. Quite simply, how much money did the app make? That’s your total revenue – a simple but crucial mobile app metric. You want to calculate how much your app has made in a day, a week or a month. You could then compare it to the industry average, or the investment you put in or what your projected expectation was.
If you have multiple revenue streams like subscriptions, in-app purchases or premium upgrades, you may want to monitor them independently and see how each one is faring.
The average order value determines how much money is being spent by each app user. This KPI can only be used as an indicator of averages and lets you get an idea of the direction you are going in. However, it does not tell you much more because not all users spend the same amount of money.
Lifetime value is another one of the most important mobile app KPIs that tells you how much revenue was generated by a user from the time they got onboard to the time they stopped using your app for good. LTV is one of those app metrics that helps you put things in perspective and predict how much money your app may make in the future. Old and long time users always tend to spend more than users and retaining users with high LTV must be a priority. So tracking user LTVs helps you thank and reward your high-value users and keep them loyal.
ARPU gives you the average of how much revenue each user is generating. This helps you determine if you will hit the target revenue and also lets you make sure low-revenue users don’t lower the ARPU.
So there you have it – the complete list of important mobile app metrics and KPIs you must track to measure, optimize and ensure the growth of your app. Needless to say you need to use the best analytics tools to keep all these metrics in check, but just having this list of KPIs handy helps you monitor the things that truly matter to your app, and not sweat the small stuff that isn’t relevant to you. At the end of the day, you want to maximize your revenue, do a bang-up job of branding your business and create a highly engaged community of loyal users. Once you have all the above metrics going in your favor, you can consider all these goals accomplished.
Create the most stunning apps with this super detailed design guide

An infographic detailing your journey from an idea to a complete app.